How Do Floods Form? Causes, Types & Protection (US Guide)
Key takeaways
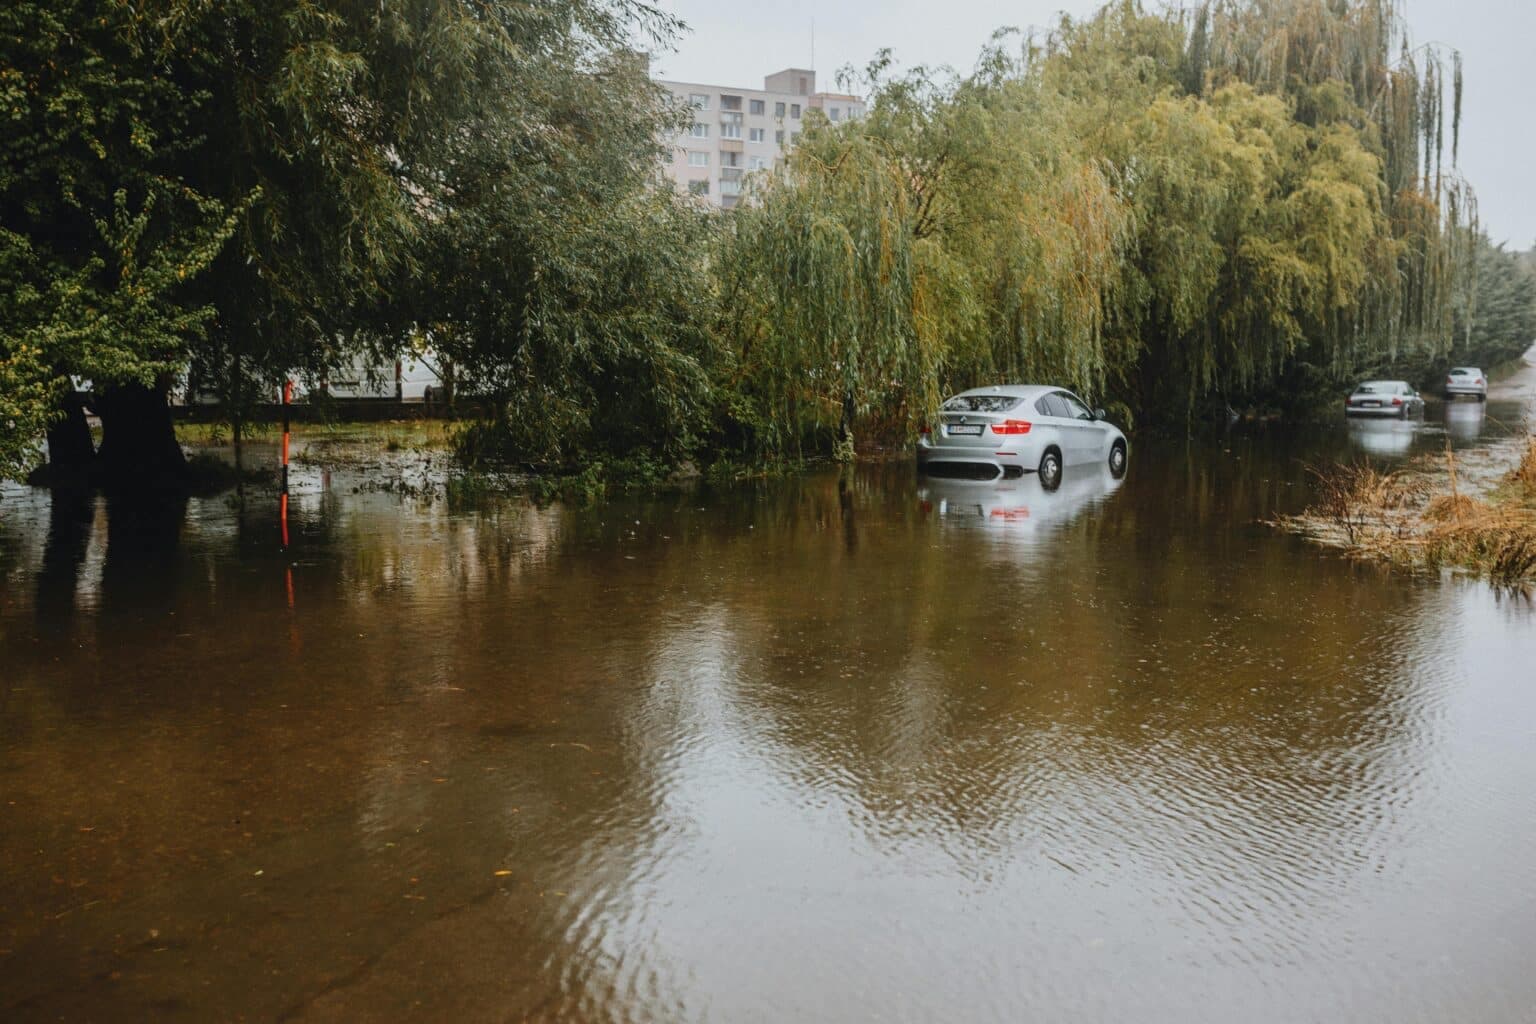
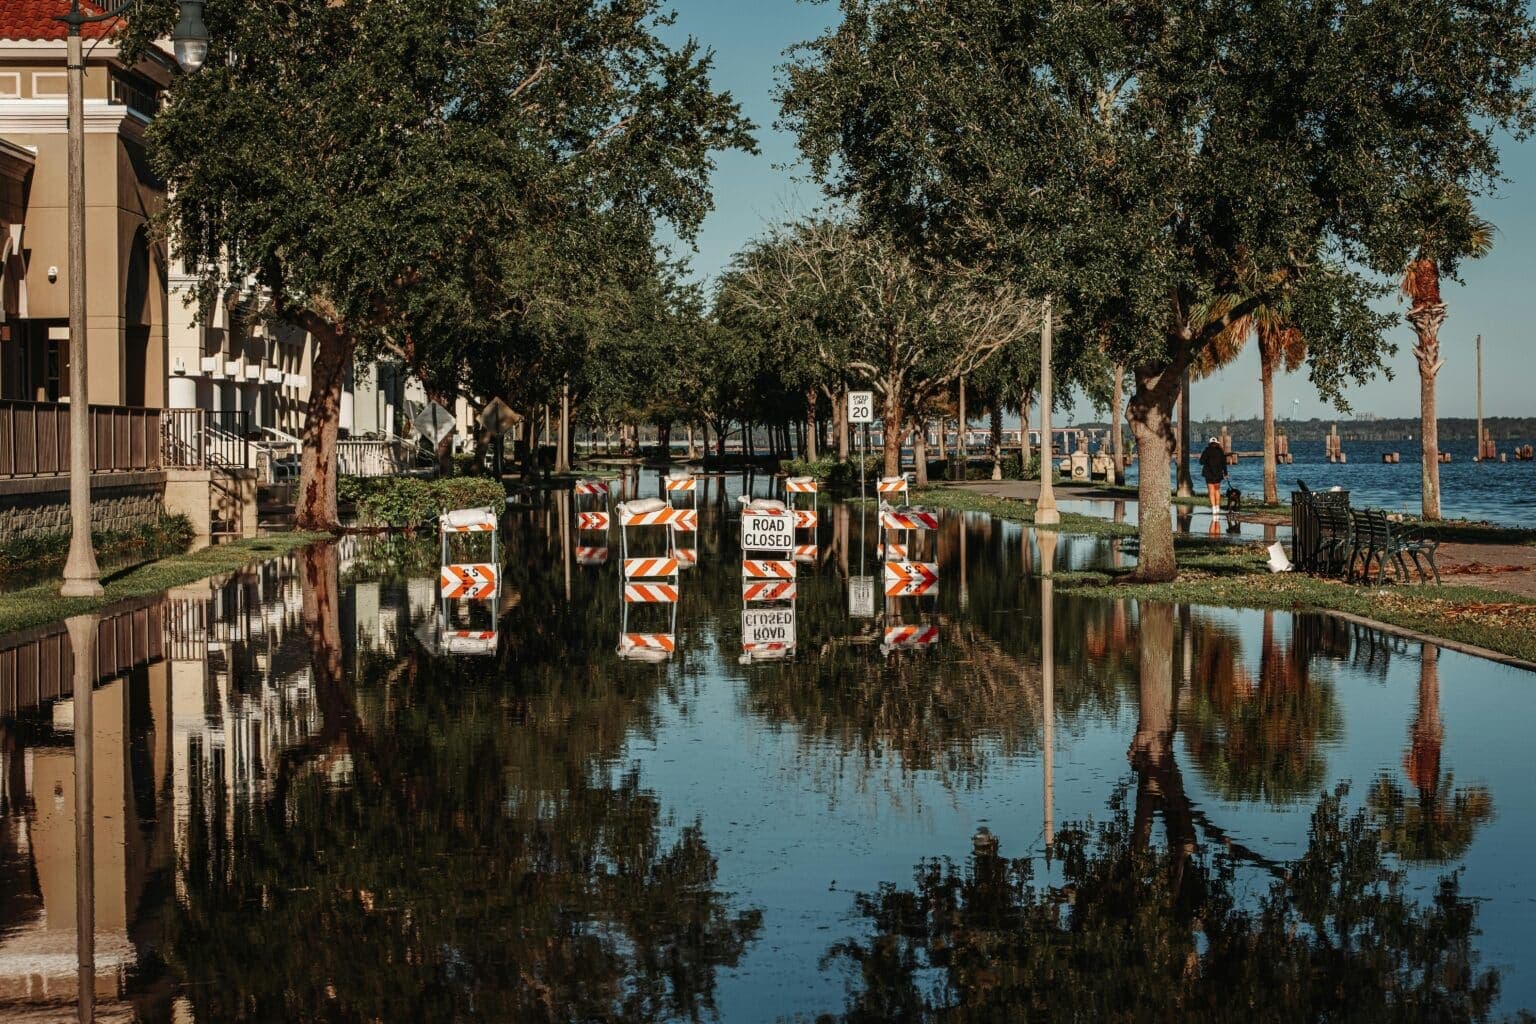
- A flood is a temporary submersion of normally dry land by water: river overflow, rising groundwater, rainfall runoff exceeding drainage capacity, or coastal storm surge.
- A 100-year flood has a 1% chance of being equaled or exceeded in any given year; over a 30-year mortgage, the cumulative probability is roughly 26%.
- Flood type sets warning time: a Mississippi River flood builds over days, while a flash flood can peak within minutes of intense rainfall.
- A warmer atmosphere holds roughly 7% more water vapor per additional degree Celsius (Clausius-Clapeyron), which is released as more intense precipitation.
- Groundwater flooding enters through slabs, foundations and utility conduits, so door barriers help little; it calls for waterproof slabs, sump pumps and sealed penetrations.
Flooding is the most common and costly natural disaster in the United States, whether it’s a slow-rising river flood on the Mississippi, a flash flood tearing through a Texas Hill Country creek, or storm surge from a hurricane like Hurricane Harvey. Each type forms through distinct physical mechanisms, and each is being intensified by land development and climate change, a trend our related article on heavy rainfall and flooding across the US documents in detail. This guide breaks down how floods actually form, the main flood types facility managers need to plan for, and where building-level protection fits into a broader flood risk strategy.
Scope of this article: anhamm does not design collective flood infrastructure (levees, detention basins). Our products are mechanical, building-level flood barriers for doors, docks, and industrial openings. We cover flood formation here because it directly determines which type of protection actually makes sense for a given site.
What is a flood? Definition
A flood is a temporary submersion of normally dry land by water, whether from a river overflowing its banks, groundwater rising to the surface, rainfall runoff exceeding drainage capacity, or coastal storm surge. The Federal Emergency Management Agency (FEMA) uses this definition as the basis for mapping Special Flood Hazard Areas (SFHAs) nationwide.
A flood isn’t inherently a disaster - it’s a natural process that river systems and coastlines depend on. It becomes a risk when it meets exposure: homes, industrial parks, or infrastructure sited in areas vulnerable to rising water.
On the “100-year flood” concept: a 100-year flood is not a flood that mechanically recurs every hundred years. It’s a flood level that has a 1% chance of being equaled or exceeded in any given year. Over a building’s typical 30-year mortgage term, the cumulative probability of experiencing at least one such event is roughly 26% - and over an 80-year building lifespan, it climbs to more than half. That distinction matters far more for long-term risk planning than a single-year probability.
How floods form: the water cycle
In the water cycle, some precipitation infiltrates the soil while the rest runs off across the surface. How much runs off depends on watershed size and shape, slope, soil type, and how saturated the ground already is when a storm hits.
The three main mechanisms:
- Prolonged rainfall over several days, tied to slow-moving low-pressure systems. Once soil is saturated, it can no longer absorb additional water, and runoff accelerates sharply.
- Intense, fast-moving storms - thunderstorms, tropical systems, or “training” storm cells that repeatedly cross the same area - can drop several inches of rain in an hour, far exceeding what soil, storm drains, or a small creek can handle.
- Snowmelt, especially in spring across the Rockies and upper Midwest, contributes to river flooding, particularly when it coincides with rainfall.
Terrain and drainage dramatically affect how fast this happens: the time of concentration - the delay between rainfall and peak flood flow - is measured in days for a large river basin like the Mississippi, but in minutes to an hour for a small urban watershed or a Hill Country creek. That’s why the National Weather Service can forecast Mississippi River flooding days in advance, while a flash flood warning may give residents only minutes to react.
The four main flood types in the US
These flood types differ mainly in how fast they form, how much warning time is available, and which type of protection can realistically be deployed in time.
River flooding
Heavy, sustained rainfall across a large watershed causes rivers like the Mississippi, Missouri, or Ohio to rise gradually over days. This slower buildup typically allows several days of lead time for facilities to activate emergency protocols, monitor gauges, and deploy temporary protection where needed.
Wetlands and natural floodplains normally act as a buffer, temporarily storing part of the floodwater volume. The next section shows how much of that natural buffering capacity has been lost to development across the US.
Flash flooding and urban runoff
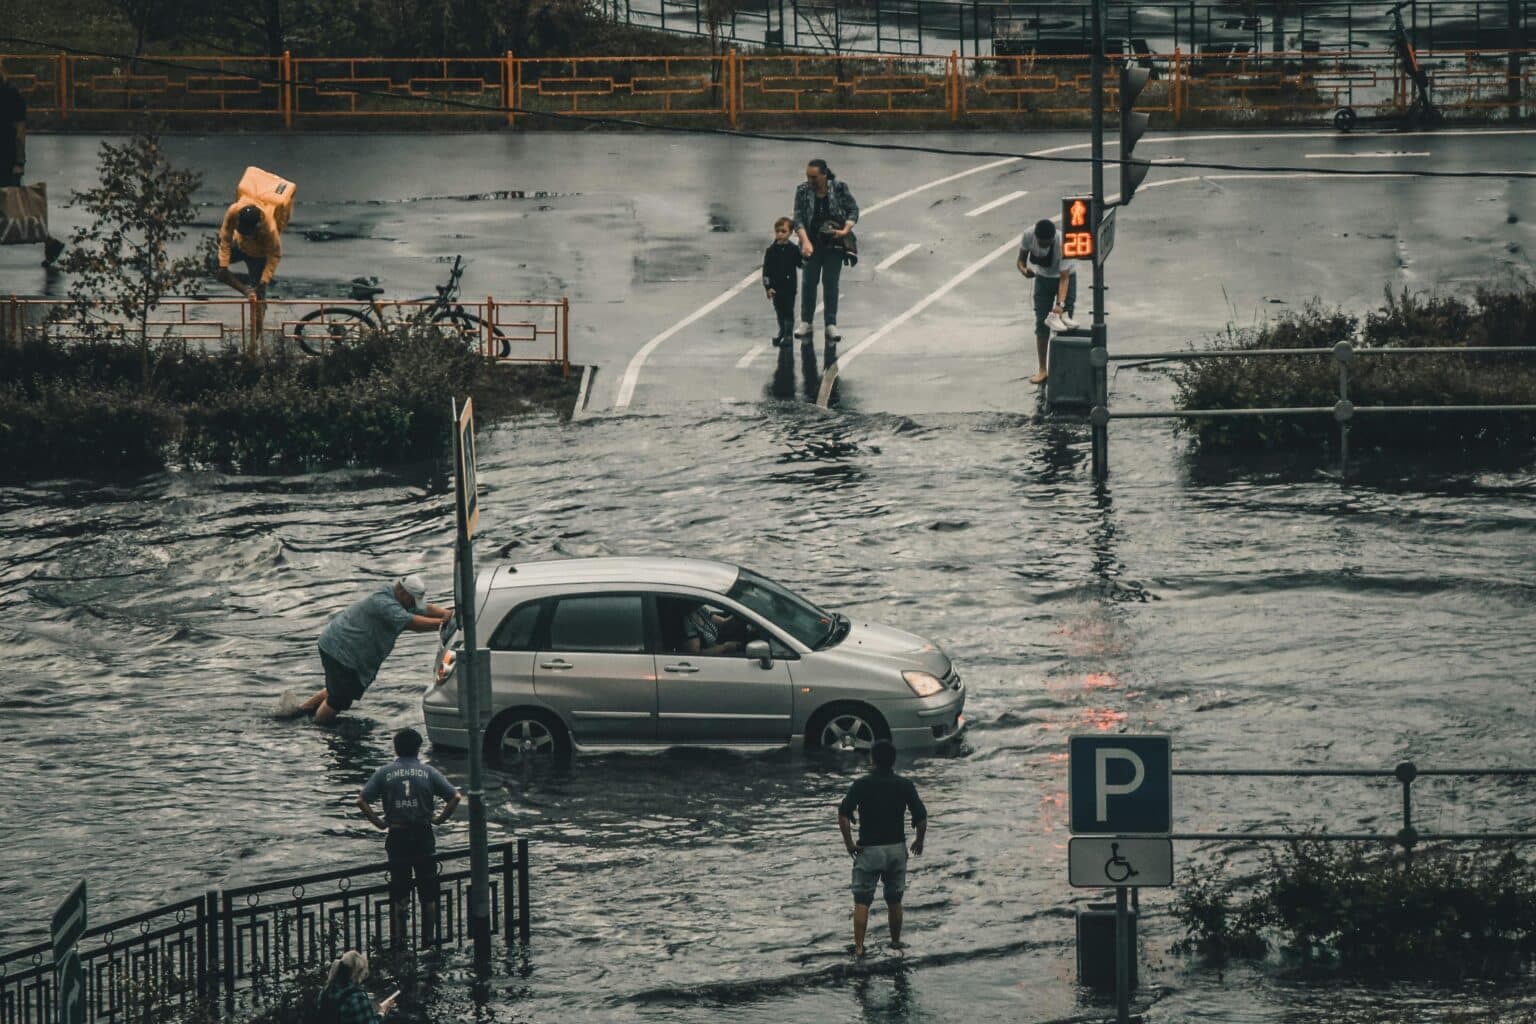
Flash floods result from brief, intense rainfall, often far from any major waterway, and urban drainage can be overwhelmed in the same way. Hurricane Harvey showed the scale of the problem in August 2017: the storm stalled over southeast Texas for days, with a highest storm total of 60.58 inches near Nederland, Texas. The National Hurricane Center calls it the most significant tropical cyclone rainfall event in US history. It attributes at least 68 direct deaths to Harvey, all in Texas and almost all from freshwater flooding, and gives a damage estimate of $125 billion (90% confidence range: $90-160 billion).
For industrial and logistics operators, loading docks, yards, and below-grade access points remain especially exposed: an urban runoff event can overwhelm storm drains within minutes, even at facilities located well away from any waterway officially mapped as flood-prone.
Groundwater and basement flooding
After weeks of sustained rainfall, groundwater levels can rise until water pushes up through slabs, foundations, and utility conduits. This is a distinct mechanism from surface runoff and can affect facilities even where there’s no visible flooding at the surface, due to underground hydraulic connections between aquifers and nearby waterways.
This flood type calls for different solutions than surface flooding does - waterproof slabs, sump pumps, sealed utility penetrations. Mechanical barriers placed at doors or loading bays have limited effect here, since water is entering through the ground itself rather than over a threshold.
Storm surge and coastal flooding
Storm surge occurs when a hurricane’s winds push a wall of ocean water onshore, often compounded by high tide. It remains one of the top flood risks for ports, refineries, and coastal logistics hubs from Texas to the Carolinas.
Levees, seawalls, and coastal barriers are the standard collective defenses, but facilities in FEMA-mapped coastal high-hazard zones (Zone V) still need their own building-level protection for the residual risk that collective infrastructure can’t fully eliminate.
How land development worsens flood risk
Floods are natural events, but development changes their frequency, speed, and the scale of resulting damage - and this effect is measurable.
Loss of wetlands and floodplains. Development has eliminated a large share of natural floodplain storage across many US watersheds over the past century, particularly in fast-growing metro areas. These wetlands historically functioned as a sponge, reducing downstream flood peaks during heavy rain events.
Impervious surfaces. Parking lots, warehouses, and paved industrial parks prevent rainwater infiltration and route it directly into storm drains or nearby waterways. As the US EPA puts it, impervious surfaces reduce infiltration and increase surface runoff - for industrial sites, this means heavily paved yards and loading areas raise the local flood risk on top of whatever a facility’s official flood zone designation already indicates.
Climate change: what’s actually measured
Warming alters precipitation patterns and intensifies the water cycle in ways that are now directly measured, not just projected. Our companion article on climate change and flooding for US industrial facilities covers this trend in more depth, including sector-specific exposure data.
The underlying physics: a warmer atmosphere can hold roughly 7% more water vapor for every additional degree Celsius, a relationship known as the Clausius-Clapeyron equation. When that air cools or rises, the extra moisture is released as more intense precipitation. The IPCC’s Sixth Assessment Report projects extreme daily precipitation to intensify by about 7% for each 1 °C of global warming.
What’s documented for the US: NOAA’s billion-dollar disaster database counts 403 weather and climate disasters with losses of at least $1 billion each between 1980 and 2024. Of these, 45 are classified as flooding events, with about $203 billion in losses (CPI-adjusted); much flood damage also falls under the tropical cyclone and severe storm categories, which are counted separately. NOAA stopped updating the database in 2025. NOAA’s U.S. Climate Normals show that the eastern two-thirds of the contiguous US was wetter in 1991-2020 than in 1981-2010.
What this means going forward: events currently classified as “100-year floods” are expected to occur more frequently in many US regions as extreme rainfall intensifies. That’s one reason updated FEMA flood maps are more reliable for assessing future risk than relying on historical flood records alone.
Flood risk for businesses and facilities
Direct risks include danger to personnel from fast-moving water, structural damage, contamination from fuel or chemical releases, and associated soil erosion. For businesses, this compounds into:
- Production downtime and supply chain disruption, as seen widely across Houston-area industrial facilities after Hurricane Harvey
- Destruction of machinery, inventory, and IT infrastructure
- Release of hazardous materials stored onsite, with associated soil and water contamination risk
- Interference with fire protection systems - an often-overlooked point, since firewater retention and flood protection frequently share the same building weak points, as covered in our guide to warehouse fire protection
Longer-term costs include repair expenses, rising insurance premiums under the National Flood Insurance Program, business interruption, and stricter regulatory requirements for facilities located in FEMA-designated flood zones.
US flood risk framework: FEMA and NFIP
In the US, flood risk is primarily managed through FEMA’s Flood Insurance Rate Maps (FIRMs), which designate Special Flood Hazard Areas and assign zone classifications (A zones for high-risk areas, V zones for coastal areas with an additional hazard from storm waves, X zones for moderate- and low-risk areas). In communities that participate in the NFIP, these maps determine whether flood insurance is mandatory for a federally backed mortgage, and they set the baseline for local building codes in flood-prone areas.
The National Flood Insurance Program (NFIP), administered by FEMA, provides federally backed flood insurance and requires participating communities to adopt minimum floodplain management standards, including elevation requirements for new construction in Special Flood Hazard Areas.
An important caveat for your specific project: this framework sets general principles, but the exact flood zone designation, base flood elevation, and required protection level for a specific parcel depend on the current FEMA FIRM for that county and, where applicable, local floodplain management ordinances. This article does not replace that site-specific determination.
For real-time river levels and flood forecasts, the National Weather Service publishes active flood warnings and river gauge data across all major US watersheds, and NOAA’s climate monitoring resources track the longer-term trends behind rising flood frequency.
From collective defenses to building-level protection
Flood protection works across several layers: avoiding exposure in the first place, natural retention, collective infrastructure, building-level protection, and emergency planning. The first step is always a site-specific assessment: FEMA flood zone status, local drainage history, and elevation relative to the base flood.
Typical weak points at industrial sites
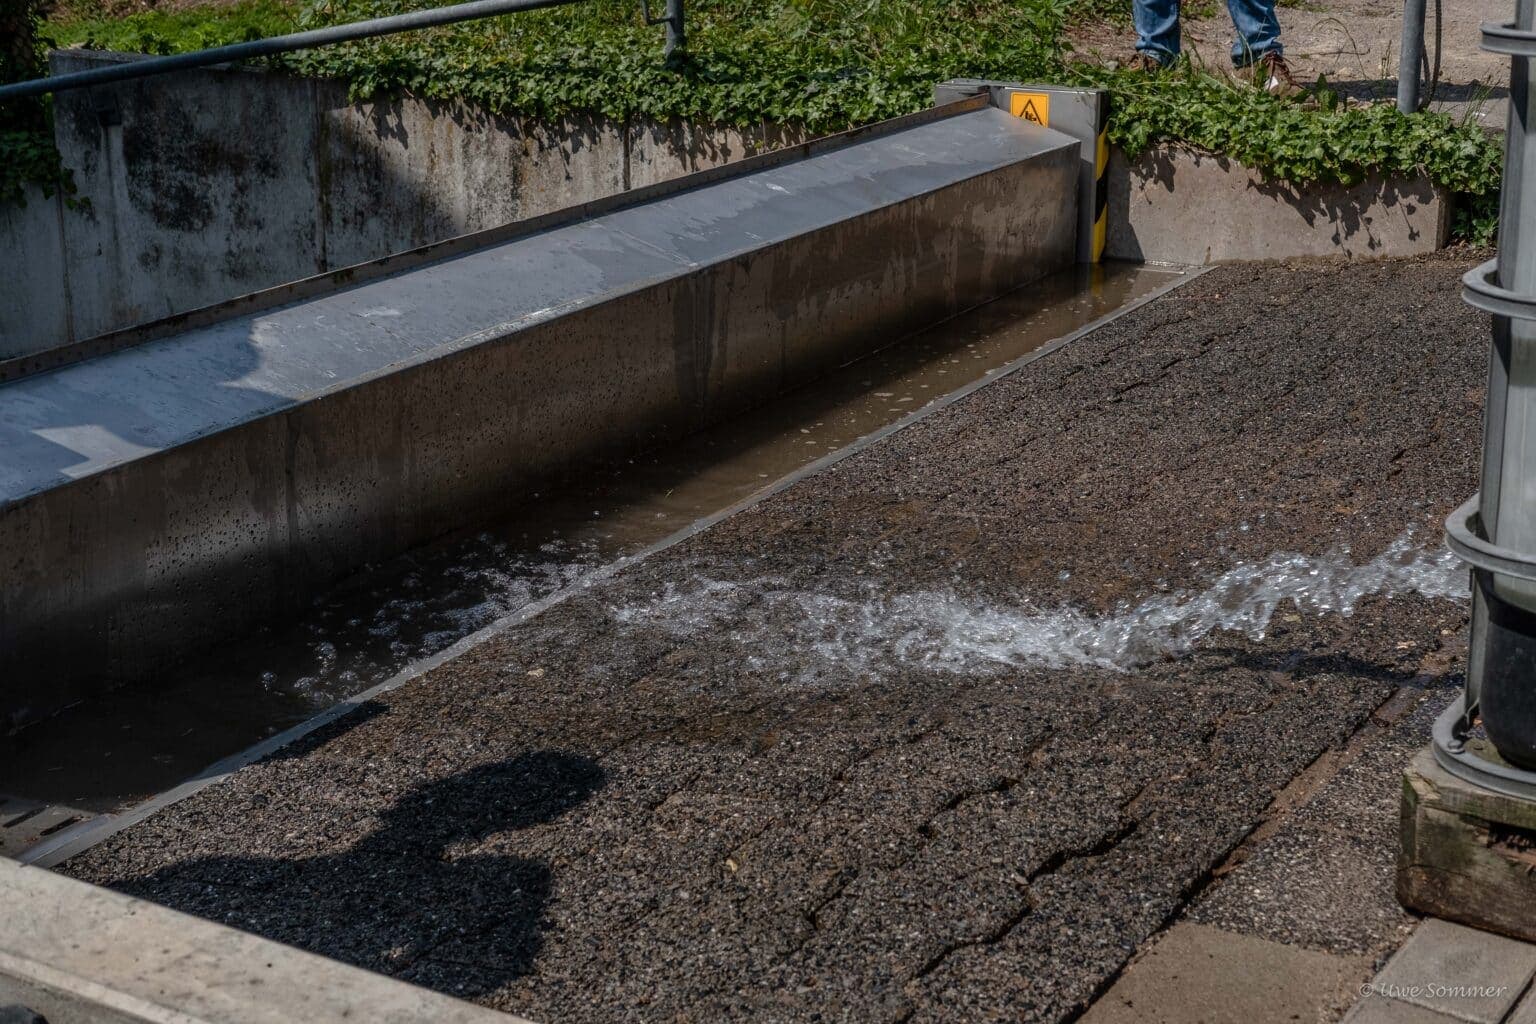
Loading dock doors, ramps, delivery bays, and ventilation openings are the classic entry points for floodwater. Solutions range from fixed thresholds to deployable flood barriers, up to fully automatic systems that are activated by the water itself, without any power supply - the same approach detailed in our guide to flood protection for doors and windows.
Key characteristics of the Anhamm Water Spillbarrier:
| Characteristic | Value |
|---|---|
| Vehicle drive-over resistance | Drive-over capability tested under RW-TÜV supervision (DIN 1055); the load rating for your traffic is confirmed during project planning |
| Watertightness duration | At least 72 hours (RW-TÜV) |
| Minimum sealing height | 300 mm, up to 2.40 m currently available |
| Opening width | Made to measure for the opening width |
| Power source | None - purely mechanical: inflowing water lifts the barrier, and springs fold it into its upright, sealed position |
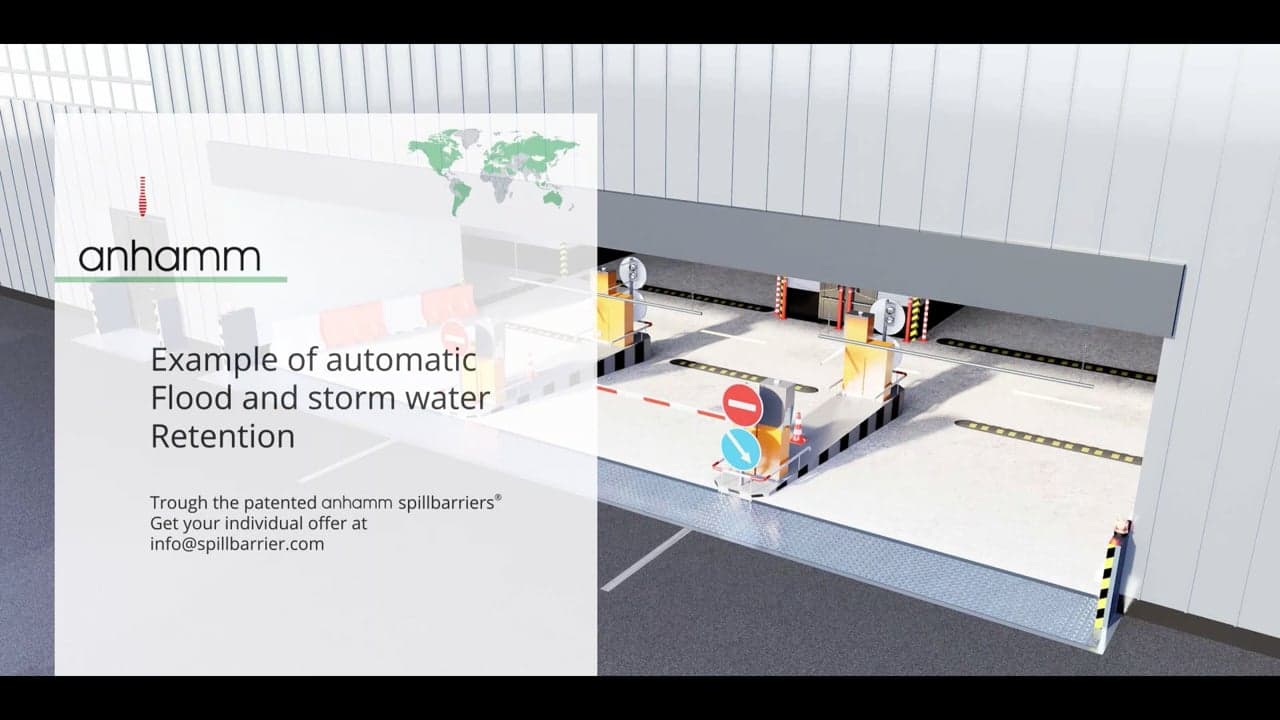
Playing loads the video from Vimeo.
Important caveat: these figures are test data for the system referenced, not a universal guarantee for every loss scenario. The correct sealing height and retention volume for a specific facility should be determined through a site-specific risk assessment - and where applicable, in consultation with local floodplain authorities - not from the product spec sheet alone.
The overlap with fire protection
One point deserves a clear callout without blending the two topics: when a fire occurs at an industrial site, the firewater used to extinguish it must also be contained, since it can carry combustion residue or chemical contaminants. This firewater retention challenge is covered separately in our warehouse fire protection guide. It remains a distinct discipline from flood protection, even though both can, in some facility layouts, rely on similar barrier hardware at the same building openings.
Practical scenarios
Logistics facility along a Gulf Coast waterway: a stalled tropical system drops over a foot of rain in 24 hours, similar to the rainfall pattern behind Hurricane Harvey. Storm drains overwhelm within the hour, flooding loading docks and ground-floor storage before staff can deploy sandbags.
Distribution center near a major river: sustained rain raises river levels over several days. Storm drain backflow and rising groundwater simultaneously flood underground parking and dock-level access - two distinct mechanisms, requiring different responses, that can combine at a single site. Our guide to flood protection for doors and garages details solutions suited to this kind of layout.
Chemical storage site downstream of aging levee infrastructure: after weeks of heavy rain, river levels approach the levee’s design capacity. Even where breach probability is low, sites located downstream of major flood control infrastructure should factor this extreme scenario into their risk assessment, beyond routine seasonal flood planning.
Frequently asked questions
What exactly is a 100-year flood?
It’s not a flood that recurs mechanically every hundred years - it’s a flood level with a 1% chance of being equaled or exceeded in any given year, as defined by FEMA. Over a 30-year mortgage, the cumulative probability of experiencing at least one such event is roughly 26%; over an 80-year building lifespan, it’s more than half. That’s why updated FEMA flood maps are more useful than historical flood records for assessing long-term risk.
Can a flood form very quickly in the US?
Yes, depending on the type. A river flood on a system like the Mississippi builds over several days, giving a relatively long warning window. A flash flood, like the flooding Hurricane Harvey triggered across Houston in 2017, can form within minutes to hours after an intense rainfall event. For an industrial facility, this means protection needs to be sized for the fastest realistic scenario, not just the average case.
Can a facility flood even if it’s outside a FEMA flood zone?
Yes. FEMA flood maps are based on historical and modeled data, and many are not fully updated for current rainfall intensity or new development patterns nearby. Flash flooding can also occur along small creeks or drainage channels that aren’t mapped as high-risk. Checking FEMA’s flood map service is a starting point, not a full risk assessment.
Can a site protected by a levee still flood?
Yes. Levees and collective flood infrastructure are engineered to a specific design flood level. During an extreme event, a structural failure, or a localized runoff event, residual risk remains - as demonstrated by major levee-related flooding events in US history. Combining collective infrastructure with building-level protection remains essential.
What’s the difference between permanent and deployable flood barriers?
Permanent protection, like a flood wall or raised foundation, works continuously but requires space and is hard to retrofit into an operating facility. Deployable systems, like removable flood panels, offer flexibility but require staff to install them in time - a serious limitation during a flash flood that may allow only minutes of warning. Automatic barriers activated by the water itself combine constant readiness with normal daily site use: drivable, no setup time, no power required.
What are the first steps a business should take to prepare for flood risk?
Start with a site assessment: check the facility’s FEMA flood zone status, local drainage patterns, and elevation relative to the base flood. Next, identify critical exposure points: hazardous material storage, IT infrastructure, backup power, loading docks, and below-grade areas. Finally, build a layered protection strategy combining operational procedures, site improvements, and technical barriers at the most exposed openings.
Conclusion: what facility managers should take away
A flood always results from the combination of weather, watershed characteristics, and how humans have altered the surrounding land. Three points deserve particular attention:
- Flood type determines warning time - and therefore which protection can actually work. Relying solely on deployable systems that require setup time leaves a facility exposed during a flash flood that may give only minutes of warning, as Hurricane Harvey demonstrated across Houston.
- Natural buffers have largely disappeared. Lost wetlands and expanding impervious surfaces mean water that was once temporarily stored now arrives faster and in greater volume.
- Climate change is no longer a hypothesis - it’s a measured trend documented in NOAA climate data, and the IPCC expects heavy precipitation events to intensify and become more frequent in most regions with further warming.
For a documented real-world case with strong parallels to US flood vulnerabilities, our analysis of the 2021 Ahr Valley flood shows how the same structural weaknesses show up across countries with very different flood histories.
Need to assess your facility’s flood risk?
Our engineers evaluate your site’s specific exposure and design a barrier system sized to your actual flood risk, not a one-size-fits-all spec sheet.
Request a technical assessmentSources
- National Hurricane Center: Tropical Cyclone Report, Hurricane Harvey (AL092017)
- NOAA NCEI: U.S. Billion-Dollar Weather and Climate Disasters, United States summary 1980-2024
- NOAA NCEI: U.S. Climate Normals 1991-2020
- IPCC AR6 WG1: Summary for Policymakers (2021)
- US EPA CADDIS: Urbanization and stormwater runoff
- FEMA FloodSmart: What is my flood zone?
About the author
Anhamm is a family business that has developed and manufactured mechanical retention systems for firewater, hazardous substances and floods for over 30 years; its barriers are delivered to 40 countries.
Disclaimer: this article reflects the state of knowledge and regulation at the time of publication. It does not replace a site-specific hydrological study, professional engineering assessment, or legal advice. Facility owners should consult FEMA flood maps and local floodplain management authorities before sizing any flood protection measure.